lab1
【实验题目】系统软件启动过程
【实验目的】
操作系统是一个软件,也需要通过某种机制加载并运行它。在这里我们将通过另外一个更加简单的软件-bootloader 来完成这些工作。为此,我们需要完成一个能够切换到x86 的保护模式并显示字符的bootloader,为启动操作系统ucore 做准备。lab1 提供了一个非常小的bootloader 和ucoreOS,整个bootloader 执行代码小于512 个字节,这样才能放到硬盘的主引导扇区中。通过分析和实现这个bootloader 和ucore OS,读者可以了解到:
● 基于分段机制的存储管理
● 设备管理的基本概念
● PC 启动bootloader 的过程
● bootloader 的文件组成
● 编译运行 bootloader 的过程
● 调试 bootloader 的方法
● ucore OS 的启动过程
● 在汇编级了解栈的结构和处理过程
● 中断处理机制
● 通过串口/并口/CGA 输出字符的方法
【实验方案】
包括:硬件或虚拟机配置方法、软件工具与作用、方案的思想、相关原理、程序流程、算法和数据结构、程序关键模块,结合代码与程序中的位置位置进行解释,组员工作分工。
虚拟机使用Ubuntu,主要的代码编辑与查看工具VSCode,结合Ucore启动过程指导与网上的资料完成实验。
练习 1:理解通过make 生成执行文件的过程。(要求在报告中写出对下述问题的回答)
在此练习中,大家需要通过静态分析代码来了解:
- 操作系统镜像文件 ucore.img 是如何一步一步生成的?(需要比较详细地解释Makefile 中每一条相关命令和命令参数的含义,以及说明命令导致的结果)
首先找到创建ucore.img的makefile代码如下
```makefilecreate ucore.img
UCOREIMG := $(call totarget,ucore.img)
$(UCOREIMG): $(kernel) $(bootblock) $(V)dd if=/dev/zero of=$@ count=10000 $(V)dd if=$(bootblock) of=$@ conv=notrunc $(V)dd if=$(kernel) of=$@ seek=1 conv=notrunc
$(call create_target,ucore.img)
可以看到要生成ucore.img首先要生成kernel和bootblock
生成kernel代码如下
```makefile
# create kernel target
kernel = $(call totarget,kernel)

$(kernel): tools/kernel.ld

$(kernel): $(KOBJS)
	@echo + ld $@
	$(V)$(LD) $(LDFLAGS) -T tools/kernel.ld -o $@ $(KOBJS)
	@$(OBJDUMP) -S $@ > $(call asmfile,kernel)
	@$(OBJDUMP) -t $@ | $(SED) '1,/SYMBOL TABLE/d; s/ .* / /; /^$$/d' > $(call symfile,kernel)

$(call create_target,kernel)
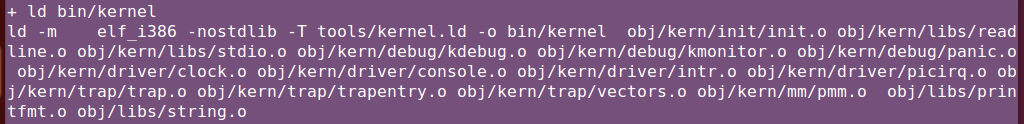
运行makefile,在其中找到kernel的实际命令为
关键参数
-m 模拟指定的连接器
-nostdlib 不使用标准库
-T 指定命令文件
-o 指定输出文件的名称
可以发现生成kernel所需要的文件有:tools/kernel.ld obj/kern/init/init.o obj/kern/libs/readline.o obj/kern/libs/stdio.o obj/kern/debug/kdebug.o obj/kern/debug/kmonitor.o obj/kern/debug/panic.o obj/kern/driver/clock.o obj/kern/driver/console.o obj/kern/driver/intr.o obj/kern/driver/picirq.o obj/kern/trap/trap.o obj/kern/trap/trapentry.o obj/kern/trap/vectors.o obj/kern/mm/pmm.o obj/libs/printfmt.o obj/libs/string.o
生成这些文件的makefile为下面的批处理代码
# kernel

KINCLUDE	+= kern/debug/ \
			   kern/driver/ \
			   kern/trap/ \
			   kern/mm/

KSRCDIR		+= kern/init \
			   kern/libs \
			   kern/debug \
			   kern/driver \
			   kern/trap \
			   kern/mm

KCFLAGS		+= $(addprefix -I,$(KINCLUDE))

$(call add_files_cc,$(call listf_cc,$(KSRCDIR)),kernel,$(KCFLAGS))
其实际代码为(以init.o为例)

关键参数
-fno-bultin 除非用_builtin_前缀,否则不进行builtin函数的优化
-ggdb 此选项将尽可能的生成gdb的可以使用的调试信息
-m32 生成适用于32位环境的代码
-gstabs 此选项以stabs格式声称调试信息,但是不包括gdb调试信息
-nostdinc 使编译器不在系统缺省的头文件目录里面找头文件
-fno-stack-protector不生成用于检测缓冲区溢出的代码
-I<dir> 添加搜索头文件的路径
kernel生成完成
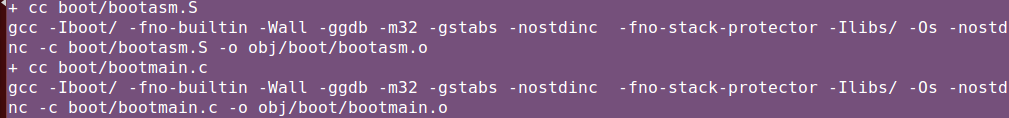
生成blootblock的makefile代码如下
# create bootblock
bootfiles = $(call listf_cc,boot)
$(foreach f,$(bootfiles),$(call cc_compile,$(f),$(CC),$(CFLAGS) -Os -nostdinc))

bootblock = $(call totarget,bootblock)

$(bootblock): $(call toobj,$(bootfiles)) | $(call totarget,sign)
	@echo + ld $@
	$(V)$(LD) $(LDFLAGS) -N -e start -Ttext 0x7C00 $^ -o $(call toobj,bootblock)
	@$(OBJDUMP) -S $(call objfile,bootblock) > $(call asmfile,bootblock)
	@$(OBJCOPY) -S -O binary $(call objfile,bootblock) $(call outfile,bootblock)
	@$(call totarget,sign) $(call outfile,bootblock) $(bootblock)

$(call create_target,bootblock)
其生成代码为

关键参数:
-N设置代码段和数据段均可读写
可以看到生成bootblock需要bootasm.o,bootmain.o,以及sign
bootasm.o和bootmain.o由以下makefile代码生成
bootfiles = $(call listf_cc,boot)
$(foreach f,$(bootfiles),$(call cc_compile,$(f),$(CC),$(CFLAGS) -Os -nostdinc))
实际代码为
sign的makefile代码为
# create 'sign' tools
$(call add_files_host,tools/sign.c,sign,sign)
$(call create_target_host,sign,sign)
生成代码为

- 一个被系统认为是符合规范的硬盘主引导扇区的特征是什么?
 char buf[512];
 memset(buf, 0, sizeof(buf));
 FILE *ifp = fopen(argv[1], "rb");
 int size = fread(buf, 1, st.st_size, ifp);
 if (size != st.st_size) {
     fprintf(stderr, "read '%s' error, size is %d.\n", argv[1], size);
     return -1;
 }
 fclose(ifp);
 buf[510] = 0x55;
 buf[511] = 0xAA;
一个磁盘主引导扇区512字节,且第510个字节为0X55,第511个字节为0XAA
练习 2:使用qemu 执行并调试lab1 中的软件。(要求在报告中简要写出练习过程)
为了熟悉使用 qemu 和gdb 进行的调试工作,我们进行如下的小练习:
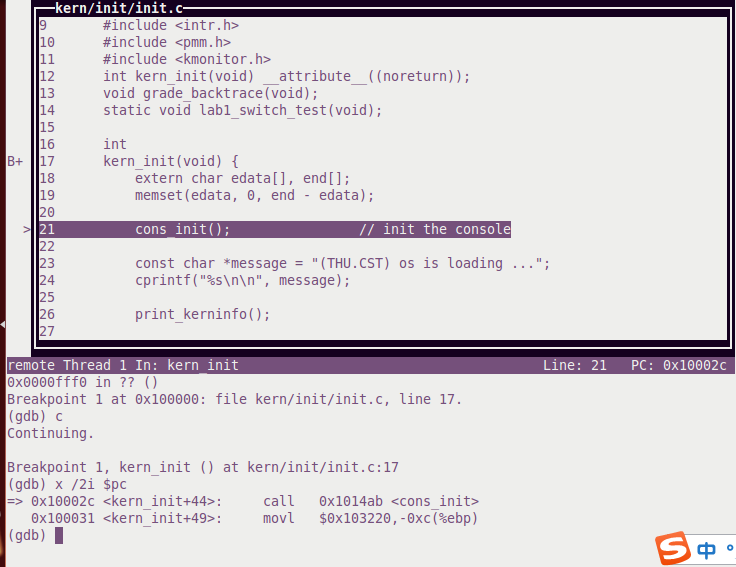
- 从 CPU 加电后执行的第一条指令开始,单步跟踪BIOS 的执行。
修改makefile中debug的代码,将调试信息存入q.log中,同时删除gdbinit中的continue语句
    debug: $(UCOREIMG)
	$(V)$(QEMU) -d in_asm -D q.log -S -s -parallel stdio -hda $< -serial null &
	$(V)sleep 2
	$(V)$(TERMINAL) -e "gdb -q -tui -x tools/gdbinit"
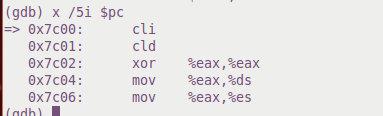
在命令行执行make debug,用next或者si单步调试,输入x /2i $pc即可查看附近两条汇编代码
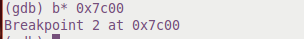
- 在初始化位置 0x7c00 设置实地址断点,测试断点正常。
在0x7c00处设置一个断点,同时从c执行,用x /5i $pc查看附近5条汇编代码,证实断点正常。
- 在调用 qemu 时增加-d in_asm -D q.log 参数,便可以将运行的汇编指令保存在q.log 中。将执行的汇编代码与bootasm.S 和bootblock.asm 进行比较,看看二者是否一致。
关闭gdb,打开我们之前改makefile生成的q.log文件,找到0x00007c00处的代码
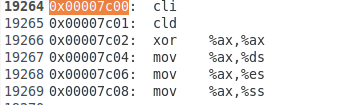
同时我们打开bootasm.S和bootblock.asm文件,可以发现,两个文件的代码其实是一样的,且与q.log 0x00007c00后的代码是一致的
练习 3:分析bootloader 进入保护模式的过程。(要求在报告中写出分析)
BIOS 将通过读取硬盘主引导扇区到内存,并转跳到对应内存中的位置执行bootloader。请分析bootloader 是如何完成从实模式进入保护模式的。
提示:需要阅读3.2.1 小节“保护模式和分段机制”和lab1/boot/bootasm.S 源码,了解如何从实模式切换到保护模式。
-
首先关中断以及数据寄存器清零
```AT&T cli # Disable interrupts cld # String operations increment# Set up the important data segment registers (DS, ES, SS). xorw %ax, %ax # Segment number zero movw %ax, %ds # -> Data Segment movw %ax, %es # -> Extra Segment movw %ax, %ss # -> Stack Segment
2. 开启A20,将A20地址线置1,以此使用32根地址线,访问4G空间
```AT&T
    # Enable A20:
    #  For backwards compatibility with the earliest PCs, physical
    #  address line 20 is tied low, so that addresses higher than
    #  1MB wrap around to zero by default. This code undoes this.
seta20.1:
    inb $0x64, %al                                  # Wait for not busy(8042 input buffer empty).
    testb $0x2, %al
    jnz seta20.1

    movb $0xd1, %al                                 # 0xd1 -> port 0x64
    outb %al, $0x64                                 # 0xd1 means: write data to 8042's P2 port
首先等待8042 input buffer为空,向其发送写数据的指令
再次等待8042 input buffer为空,将0xdf发送至0x60,打开A20
- 初始化GDB表,将其载入
lgdt gdtdesc - 进入保护模式,将cr0寄存器PE置1,开启保护模式
movl %cr0, %eax orl $CR0_PE_ON, %eax movl %eax, %cr0 - 通过长跳转更新cs的基地址
```AT&T
ljmp $PROT_MODE_CSEG, $protcseg
.code32 # Assemble for 32-bit mode protcseg:
6. 设置段寄存器,建立堆栈
```AT&T
    # Set up the protected-mode data segment registers
    movw $PROT_MODE_DSEG, %ax                       # Our data segment selector
    movw %ax, %ds                                   # -> DS: Data Segment
    movw %ax, %es                                   # -> ES: Extra Segment
    movw %ax, %fs                                   # -> FS
    movw %ax, %gs                                   # -> GS
    movw %ax, %ss                                   # -> SS: Stack Segment

    # Set up the stack pointer and call into C. The stack region is from 0--start(0x7c00)
    movl $0x0, %ebp
    movl $start, %esp
- 转到保护模式完成,call进入bootmain
call bootmain
练习 4:分析bootloader 加载ELF 格式的OS 的过程。(要求在报告中写出分析)
通过阅读 bootmain.c,了解bootloader 如何加载ELF 文件。通过分析源代码和通过qemu 来运行并调试bootloader&OS,
- bootloader 如何读取硬盘扇区的?
在启动指导中我们可以找到读一个扇区的启动流程
回到bootmain.c的代码中,我们可以按这个进行划分
/* readsect - read a single sector at @secno into @dst */
static void
readsect(void *dst, uint32_t secno) {
    // wait for disk to be ready
    waitdisk();         //等待磁盘转好

    outb(0x1F2, 1);                         // 读取扇区数目1
    outb(0x1F3, secno & 0xFF);              //读取扇区编号
    outb(0x1F4, (secno >> 8) & 0xFF);       //发出读取扇区的指令
    outb(0x1F5, (secno >> 16) & 0xFF);
    outb(0x1F6, ((secno >> 24) & 0xF) | 0xE0);
    outb(0x1F7, 0x20);                      // cmd 0x20 - read sectors

    // wait for disk to be ready
    waitdisk();

    // read a sector
    insl(0x1F0, dst, SECTSIZE / 4);         //读取数据
}
Readset包装了readsect,通过迭代使其可以读取任意长度的内容
static void
readseg(uintptr_t va, uint32_t count, uint32_t offset) {
    uintptr_t end_va = va + count;

    // round down to sector boundary
    va -= offset % SECTSIZE;

    // translate from bytes to sectors; kernel starts at sector 1
    uint32_t secno = (offset / SECTSIZE) + 1;

    // If this is too slow, we could read lots of sectors at a time.
    // We'd write more to memory than asked, but it doesn't matter --
    // we load in increasing order.
    for (; va < end_va; va += SECTSIZE, secno ++) {
        readsect((void *)va, secno);
    }
}
- bootloader 是如何加载ELF 格式的OS? 提示:可阅读3.2.3“硬盘访问概述”,3.2.4“ELF 执行文件格式概述”。
参考bootmain函数
先读取ELF的头部
判断是否ELF文件合法
找到ELF有关内存位置的描述表,并按这个描述表将数据载入内存
根据ELF头部储存的入口信息,找到内核的入口
void
bootmain(void) {
    // read the 1st page off disk
    readseg((uintptr_t)ELFHDR, SECTSIZE * 8, 0);

    // is this a valid ELF?
    if (ELFHDR->e_magic != ELF_MAGIC) {
        goto bad;
    }

    struct proghdr *ph, *eph;

    // load each program segment (ignores ph flags)
    ph = (struct proghdr *)((uintptr_t)ELFHDR + ELFHDR->e_phoff);
    eph = ph + ELFHDR->e_phnum;
    for (; ph < eph; ph ++) {
        readseg(ph->p_va & 0xFFFFFF, ph->p_memsz, ph->p_offset);
    }

    // call the entry point from the ELF header
    // note: does not return
    ((void (*)(void))(ELFHDR->e_entry & 0xFFFFFF))();

bad:
    outw(0x8A00, 0x8A00);
    outw(0x8A00, 0x8E00);

    /* do nothing */
    while (1);
}
练习 5:实现函数调用堆栈跟踪函数(需要编程)
我 们 需 要 在 lab1 中完成kdebug.c 中函数print_stackframe 的实现, 可以通过函数print_stackframe 来跟踪函数调用堆栈中记录的返回地址。在如果能够正确实现此函数,可在lab1 中执行“make qemu”后,在qemu 模拟器中得到类似如下的输出:
ebp:0x00007b28 eip:0x00100992 args:0x00010094 0x00010094 0x00007b58 0x00100096
kern/debug/kdebug.c:305: print_stackframe+22
ebp:0x00007b38 eip:0x00100c79 args:0x00000000 0x00000000 0x00000000 0x00007ba8
kern/debug/kmonitor.c:125: mon_backtrace+10
ebp:0x00007b58 eip:0x00100096 args:0x00000000 0x00007b80 0xffff0000 0x00007b84
kern/init/init.c:48: grade_backtrace2+33
ebp:0x00007b78 eip:0x001000bf args:0x00000000 0xffff0000 0x00007ba4 0x00000029
kern/init/init.c:53: grade_backtrace1+38
ebp:0x00007b98 eip:0x001000dd args:0x00000000 0x00100000 0xffff0000 0x0000001d
kern/init/init.c:58: grade_backtrace0+23
ebp:0x00007bb8 eip:0x00100102 args:0x0010353c 0x00103520 0x00001308 0x00000000
kern/init/init.c:63: grade_backtrace+34
ebp:0x00007be8 eip:0x00100059 args:0x00000000 0x00000000 0x00000000 0x00007c53
kern/init/init.c:28: kern_init+88
ebp:0x00007bf8 eip:0x00007d73 args:0xc031fcfa 0xc08ed88e 0x64e4d08e 0xfa7502a8
<unknow>: -- 0x00007d72 –
……
请完成实验,看看输出是否与上述显示大致一致,并解释最后一行各个数值的含义。
参考注释,代码如下
void
print_stackframe(void) {
     /* LAB1 YOUR CODE : STEP 1 */
     /* (1) call read_ebp() to get the value of ebp. the type is (uint32_t);
      * (2) call read_eip() to get the value of eip. the type is (uint32_t);
      * (3) from 0 .. STACKFRAME_DEPTH
      *    (3.1) printf value of ebp, eip
      *    (3.2) (uint32_t)calling arguments [0..4] = the contents in address (unit32_t)ebp +2 [0..4]
      *    (3.3) cprintf("\n");
      *    (3.4) call print_debuginfo(eip-1) to print the C calling function name and line number, etc.
      *    (3.5) popup a calling stackframe
      *           NOTICE: the calling funciton's return addr eip  = ss:[ebp+4]
      *                   the calling funciton's ebp = ss:[ebp]
      */
    //获得ebp与eip的初值
    uint32_t ebp = read_ebp();
    uint32_t eip = read_eip();
    uint32_t *arguments;
    int i,j;
    for(i = 0; i<STACKFRAME_DEPTH&&ebp; i++){
	cprintf("ebp:0x%08x eip:0x%08x args:", ebp, eip);//输出ebp和eip
	arguments = (uint32_t *)ebp + 2;                 //接收ebp+2的地址,获得参数
	for(j=0; j<4; j++){
		cprintf("0x%08x ", arguments[j]);	 //输出每一参数
	}
	cprintf("\n");
	print_debuginfo(eip-1);				 //输出caller的信息
	eip = ((uint32_t *)ebp)[1];                      //更新ebp和eip
	ebp = ((uint32_t *)ebp)[0];
   }
}
代码分析:先用read_ebp与read_eip获得最初的ebp与eip, 根据注释中的要求与要求中结果的规范,将ebp和eip输出,ebp是扩展基址指针寄存器,eip则是指令指针寄存器,因此这两个变量中储存的其实都是地址。根据注释,用arguments接收ebp+2这个地址的地址,并输出arguments[0-3],用print_debuginfo输出调用它的函数名字与行数,用ebp指针更新下一次循环时ebp与eip的值
因此,最后一行的内容的含义代表最初使用堆栈的那一个函数,即bootmain. bootloader设置的堆栈从0x7c00开始,使用call bootmain转入bootmain函数。 call指令压栈,所以bootmain中ebp为0x7bf8。
练习 6:完善中断初始化和处理(需要编程)
请完成编码工作和回答如下问题:
- 中断向量表中一个表项占多少字节?其中哪几位代表中断处理代码的入口?
在mmu.h找到表项的结构代码
/* Gate descriptors for interrupts and traps */
struct gatedesc {
    unsigned gd_off_15_0 : 16;        // low 16 bits of offset in segment
    unsigned gd_ss : 16;            // segment selector
    unsigned gd_args : 5;            // # args, 0 for interrupt/trap gates
    unsigned gd_rsv1 : 3;            // reserved(should be zero I guess)
    unsigned gd_type : 4;            // type(STS_{TG,IG32,TG32})
    unsigned gd_s : 1;                // must be 0 (system)
    unsigned gd_dpl : 2;            // descriptor(meaning new) privilege level
    unsigned gd_p : 1;                // Present
    unsigned gd_off_31_16 : 16;        // high bits of offset in segment
};
因此可以看到一个表项共有8个字节(64位),同样,在启动过程指导中也能找到相关信息
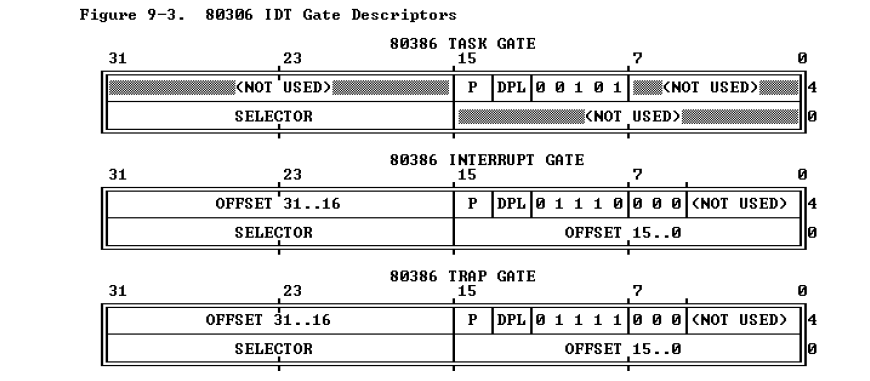
可以看出2-3字节被用作段选择子,而0-1和6-7字节则拼成位移,结合即为中断处理程序的入口地址。
- 请编程完善kern/trap/trap.c 中对中断向量表进行初始化的函数idt_init。在idt_init 函数中,依次对所有中断入口进行初始化。使用mmu.h 中的SETGATE 宏,填充idt 数组内容。注意除了系统调用中断(T_SYSCALL)以外,其它中断均使用中断门描述符,权限为内核态权限;而系统调用中断使用异常,权限为陷阱门描述符。每个中断的入口由tools/vectors.c 生成,使用trap.c 中声明的vectors 数组即可。
void
idt_init(void) {
     /* LAB1 YOUR CODE : STEP 2 */
     /* (1) Where are the entry addrs of each Interrupt Service Routine (ISR)?
      *     All ISR's entry addrs are stored in __vectors. where is uintptr_t __vectors[] ?
      *     __vectors[] is in kern/trap/vector.S which is produced by tools/vector.c
      *     (try "make" command in lab1, then you will find vector.S in kern/trap DIR)
      *     You can use  "extern uintptr_t __vectors[];" to define this extern variable which will be used later.
      * (2) Now you should setup the entries of ISR in Interrupt Description Table (IDT).
      *     Can you see idt[256] in this file? Yes, it's IDT! you can use SETGATE macro to setup each item of IDT
      * (3) After setup the contents of IDT, you will let CPU know where is the IDT by using 'lidt' instruction.
      *     You don't know the meaning of this instruction? just google it! and check the libs/x86.h to know more.
      *     Notice: the argument of lidt is idt_pd. try to find it!
      */
   extern uintptr_t __vectors[];	//声明中断入口
   int i=0;
   for (i=0; i<(sizeof(idt)/sizeof(struct gatedesc)); i ++){
        SETGATE(idt[i], 0, GD_KTEXT, __vectors[i], DPL_KERNEL);//为中断设置内核态权限
   }
   SETGATE(idt[T_SYSCALL], 0, GD_KTEXT, __vectors[T_SYSCALL], DPL_USER);//为T_SYSCALL设置用户态权限
   lidt(&idt_pd);	//转入IDT
}
代码分析:题目要求我们为每个中断设置权限,只有T_SYSCALL是用户态权限(DPL_USER),其他都为内核态权限(DPL_KERNEL), 根据注释中的提示,声明出在vector.S中的__vectors[]获得所有中断的入口,再通过循环为每个中断设置权限,为T_SYSCALL设置用户态权限,最后将IDT的起始地址装入IDTR寄存器即可。
- 请编程完善 trap.c 中的中断处理函数trap,在对时钟中断进行处理的部分填写trap 函数中处理时钟中断的部分,使操作系统每遇到100 次时钟中断后,调用print_ticks 子程序,向屏幕上打印一行文字”100 ticks”。
这个代码比较简单,按照注释来写,只需要不断的让ticks加1,当ticks达到TICK_NUM时就调用prints_ticks()函数/* LAB1 YOUR CODE : STEP 3 */ /* handle the timer interrupt */ /* (1) After a timer interrupt, you should record this event using a global variable (increase it), such as ticks in kern/driver/clock.c * (2) Every TICK_NUM cycle, you can print some info using a funciton, such as print_ticks(). * (3) Too Simple? Yes, I think so! */ ticks ++; //ticks自增 if (ticks % TICK_NUM == 0) { print_ticks(); //输出ticks } break;下面是运行操作系统后的情况(键盘输入了operation)
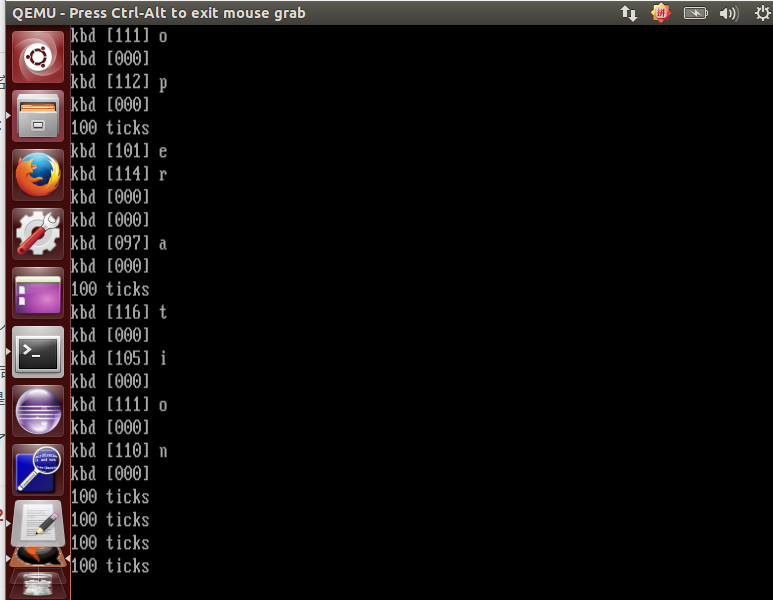
完成这问题 2 和3 要求的部分代码后,运行整个系统,可以看到大约每1 秒会输出一次”100ticks”,而按下的键也会在屏幕上显示。